Technical Details
All data is processed using the rremat package developed by the author. Please review the package documentation for specific information on processing algorithms.
Interpolating Water Quality Data
Water quality data is available for 12 key locations in the estuary. These locations were periodically sampled using a CTD profiler, which provides high-resolution vertical profiles of key water quality parameters. This data constitutes a data transect that can be interpolated to produce the water quality grids. Interpolation was performed using the Natural Neighbor Interpolation algorithm provided by Matlab and the grids were referenced to the segment delineations by assigning the segment identifier to each sampling location.
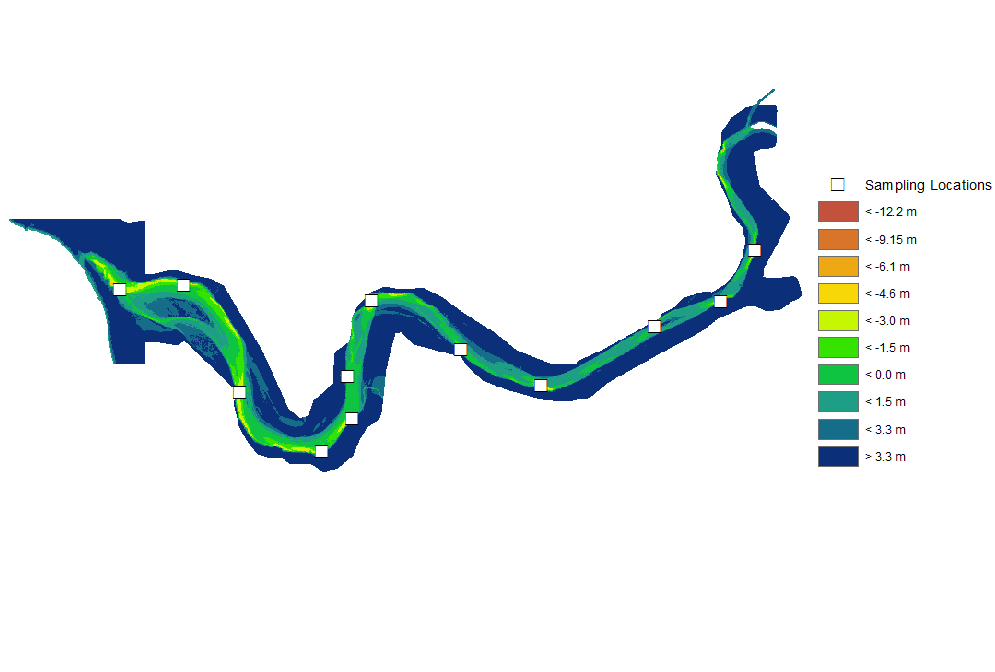
CTD profile sampling locations
Computing Estuary Volume
Estuary volume computations are derived from the 2009 bathymetry raster and a manual delineation of of the estuary thalweg using ArcMap. The thalweg was traced by manually tweaking the raster symbology to visually accentuate the high bank lines and the river thalweg; the thalweg was then traced visually by manually placing a series of points using the editor toolbar. This irregular point series was converted to a polyline representing the thalweg, after which the Construct Points tool was used to place equally-spaced points along the polyline with an interval of 100 meters. The polyline endpoint closest to the estuary mouth was defined as river distance 0, while the upstream-most endpoint of the polyline was assigned a river distance of 12200, i.e. 12.2 km upstream of the estuary mouth. This series of points was then used as input to the Euclidian Distance Allocation tool to assign each cell in the bathymetry raster the distance associated with the nearest point along the thalweg; in this way, the estuary was subdivided into 122 segments as shown below.
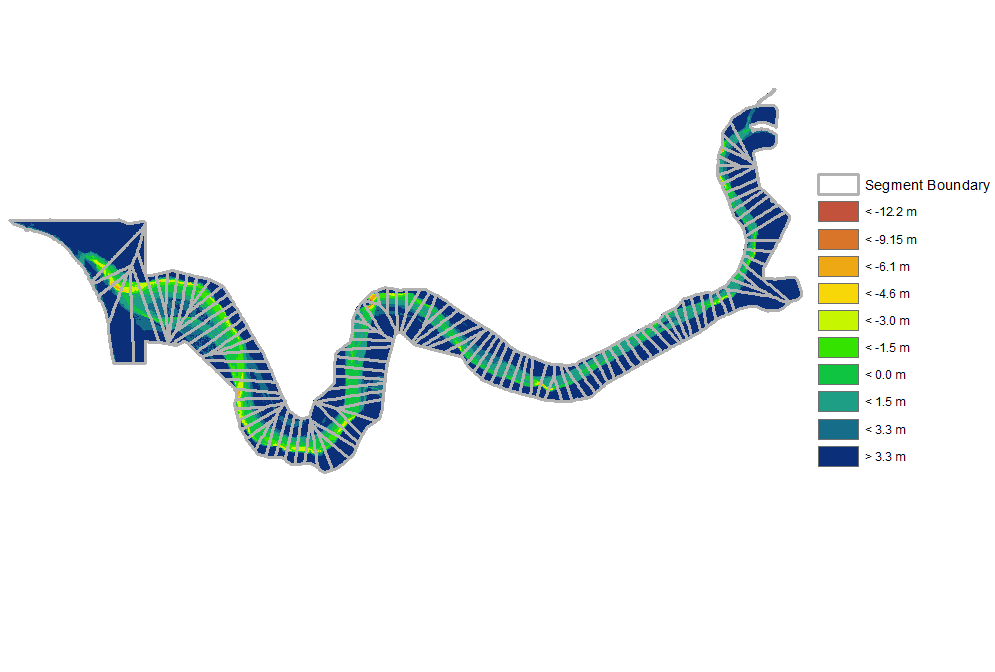
Bathymetry raster with and segment delineations
To speed up estuary volume calculations, the bathymetry raster was preprocessed by first rounding each raster cell value to the nearest 0.1 meters, and then counting the number of cells of each unique elevation in each segment to convert the raster to a flat table. Estuary volume was computed in 0.1-meter depth slices for water surface elevations ranging from -15.8 meters to +2.6 meters NGVD29 by counting the number of cells inundated in each segment for each depth interval and each water surface interval; furthermore, the number of inundated cells in each segment were subdivided according the foraging habitat categories described by the Water Quality Parameter and Habitat Productivity Technical Group. These counts were then multiplied by the bathymetry raster resolution to obtain water volumes. The stage-volume curve of the estuary for all foraging habitat categories are shown below.
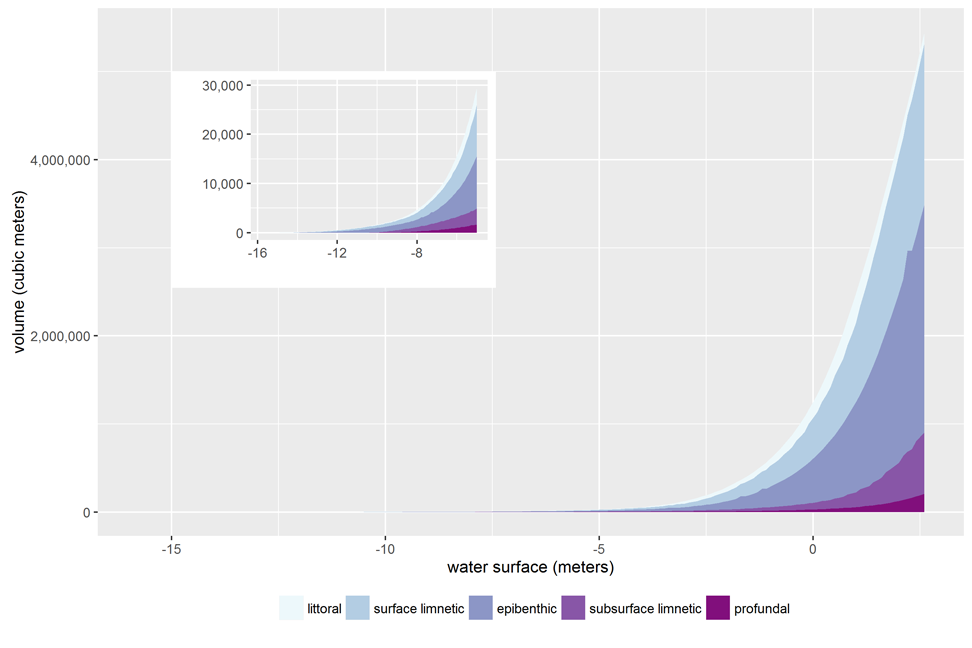
Estuary volume by foraging habitat category