I’ve been exploring juvenile salmonid habitat quality as part of my work with NOAA’s Habitat Blueprint for the Russian River estuary. NOAA and the Sonoma County Water Agency (SCWA) are interested in predicting habitat quality and availability based on river mouth conditions. The Russian River estuary, like many smaller estuaries in California, closes seasonally in the dry season; low river discharges are less effective at scouring the outlet channel, resulting in a net build-up of sediment by wave action. Eventually, a sand berm builds at the mouth and the estuary backfloods. During a closure, mixing due to waves and tides is diminished and a freshwater lens develops. This freshwater habitat is crucial to juvenile salmonids, which are still developing tolerance to saltwater conditions. In addition, a closed estuary reduces predation risk by restricting harbor seal access to the estuary and increases food availability due to inundation of vegetated area. Historically, the sand berm would be breached once the estuary water level overtopped the berm; currently, the SCWA artificially breaches the river mouth when the water level rises high enough to threaten floodplain properties. The Russian River Biological Opinion has mandated that the SCWA manage the estuary to promote juvenile salmonid rearing, and therefore there is interest in assessing the impact of current and future estuary management actions on rearing conditions.
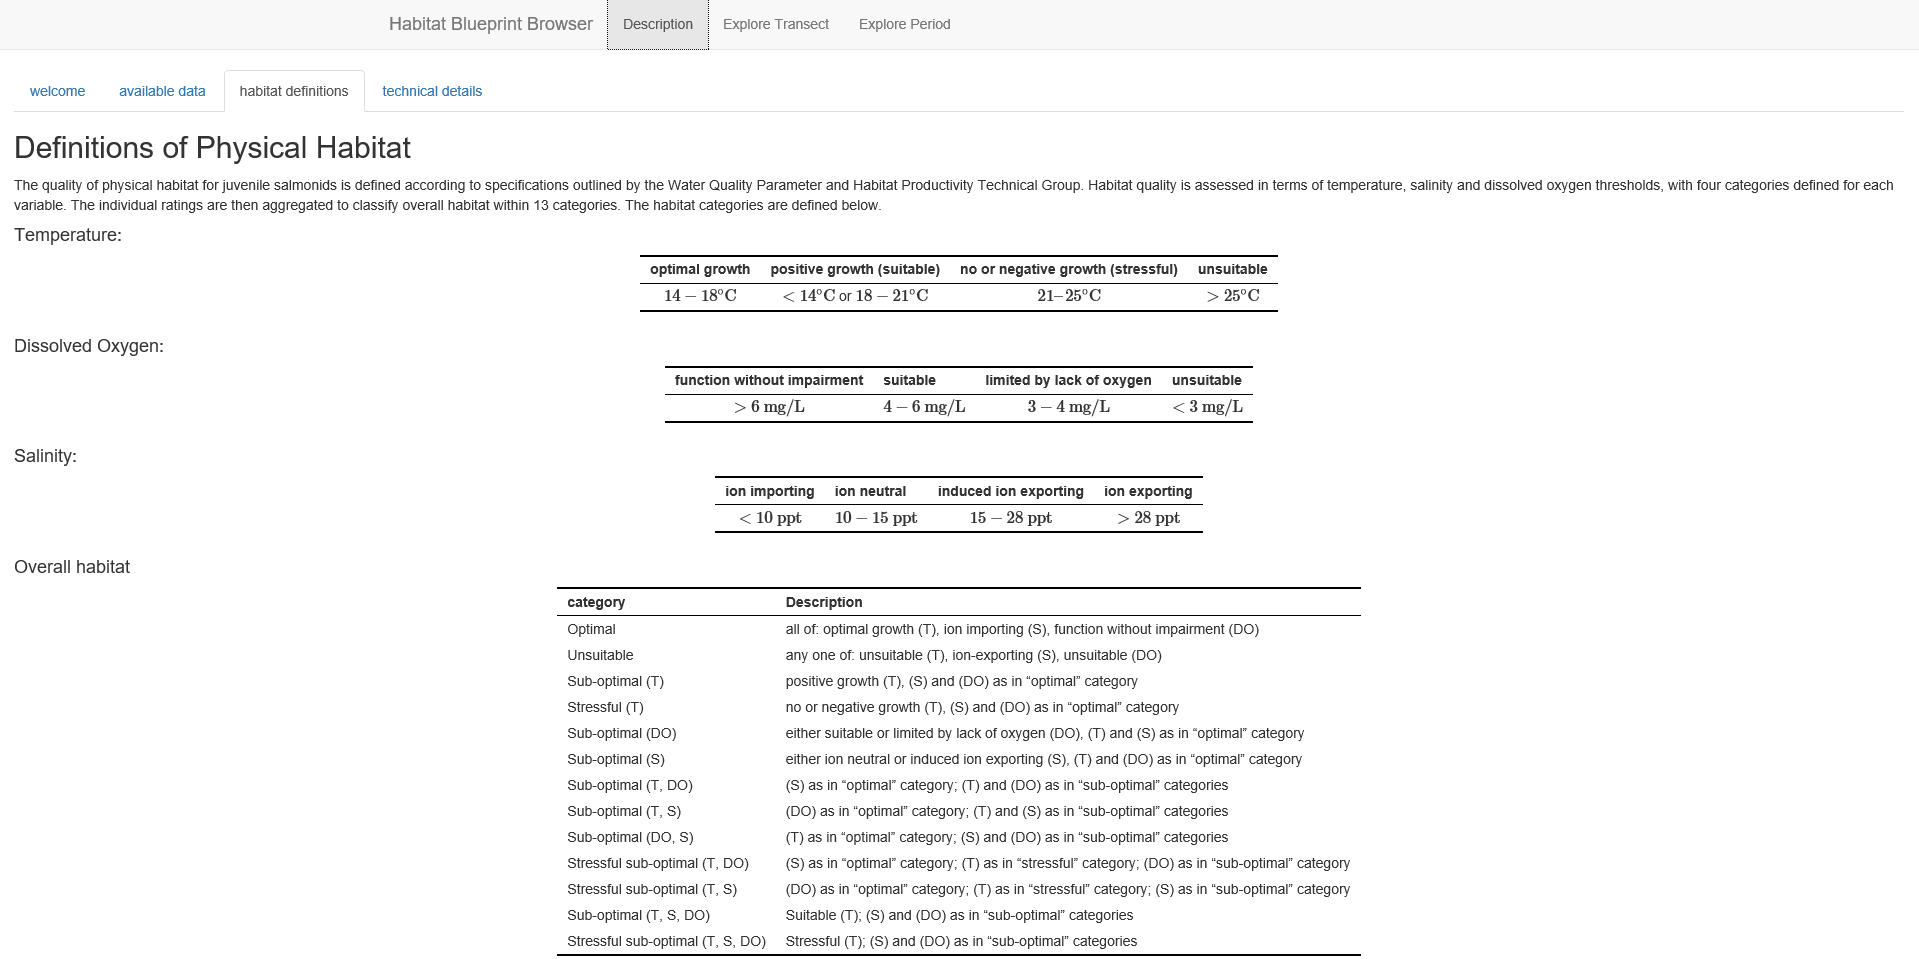
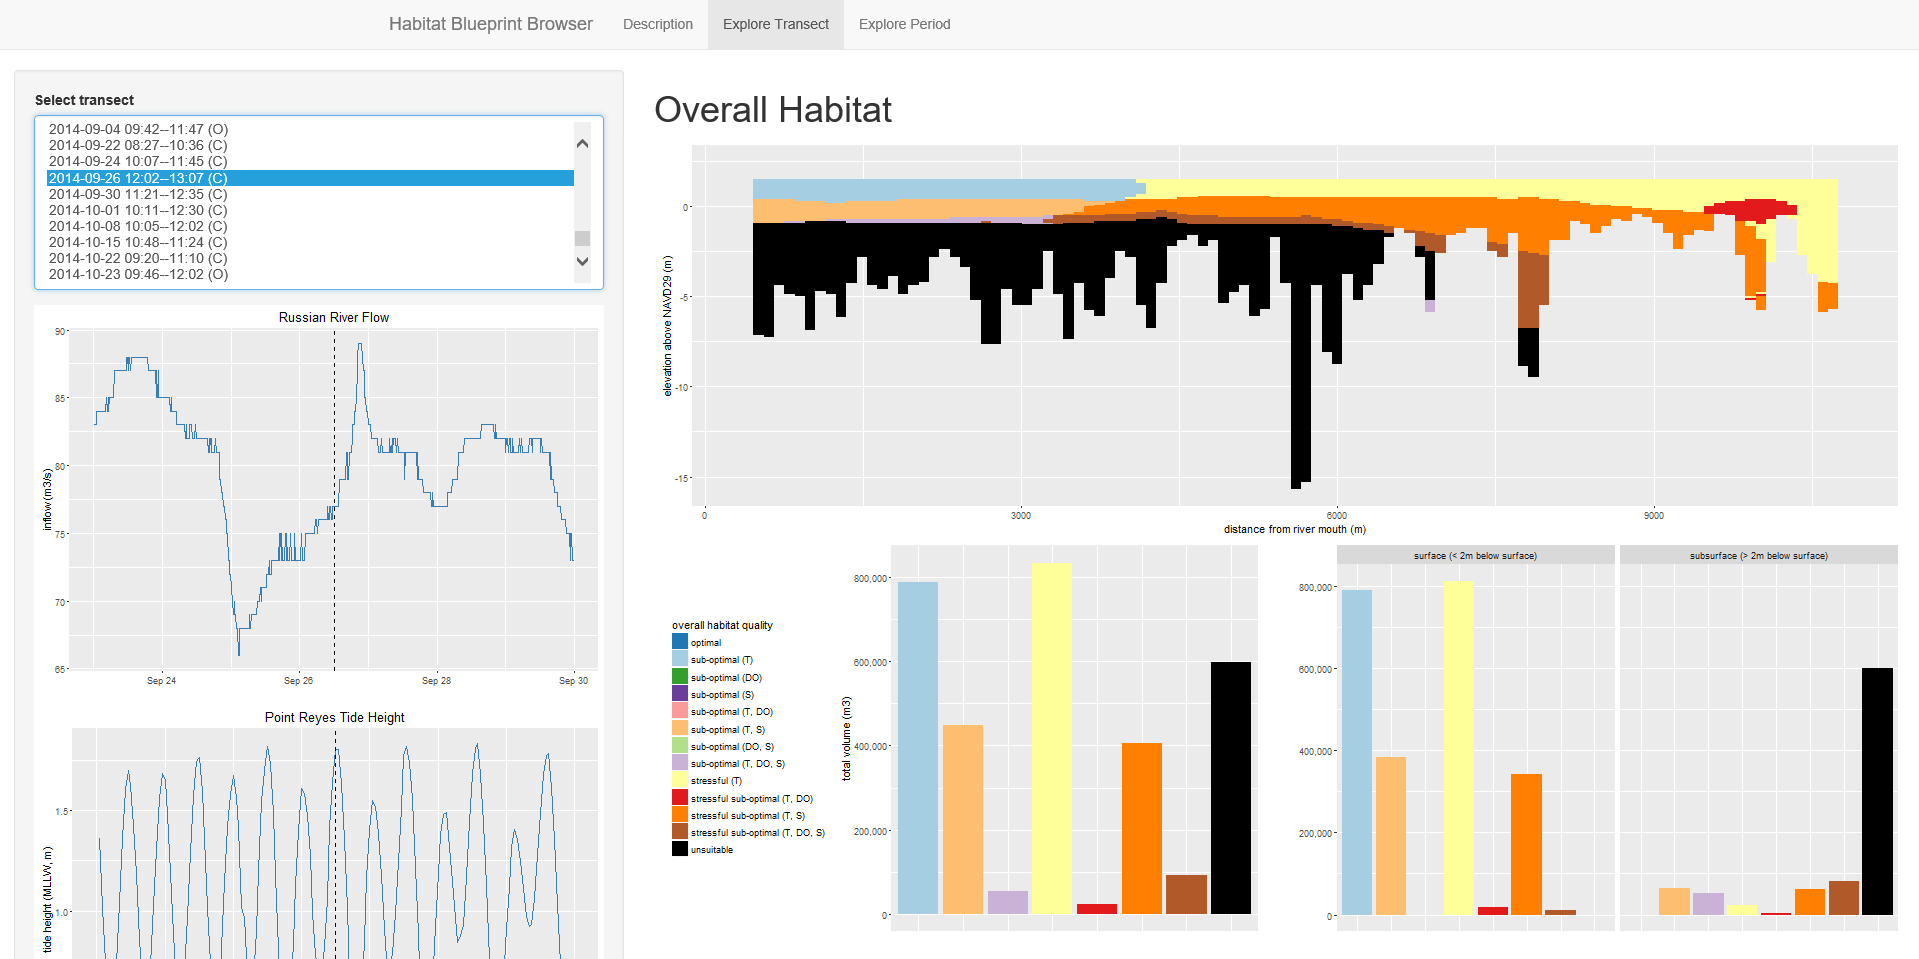
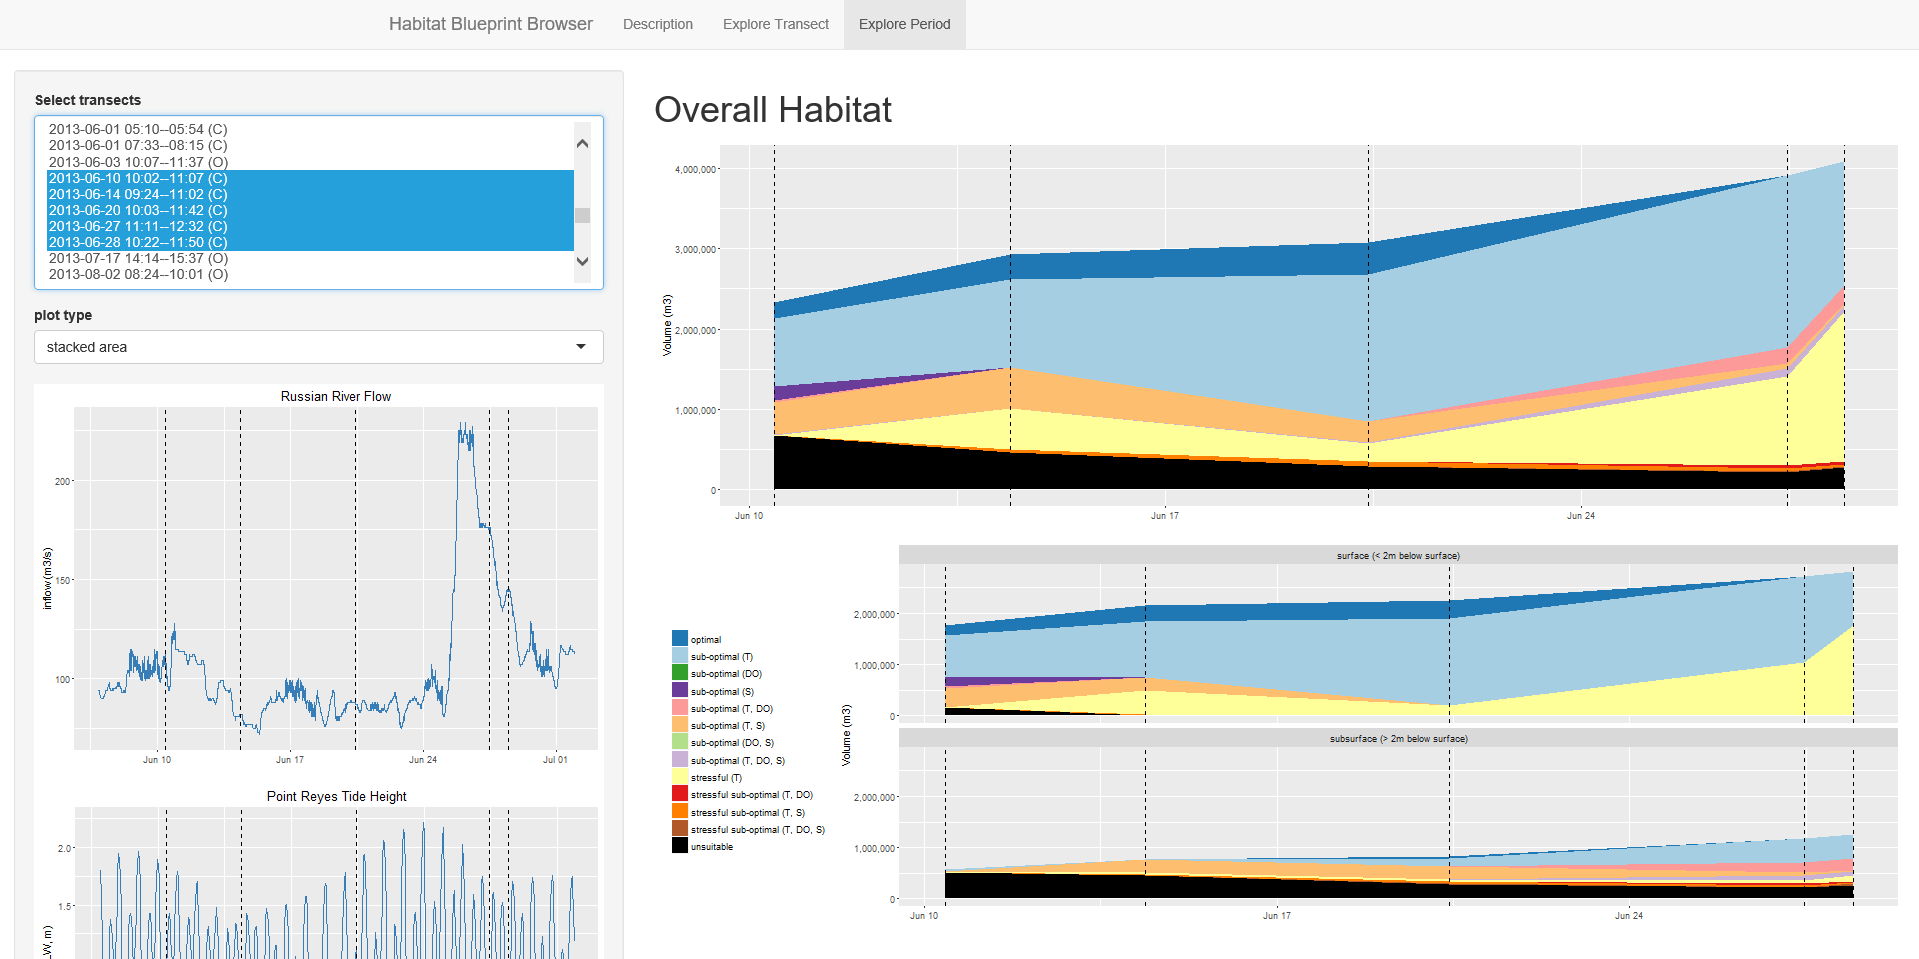
John Largier and the Bodega Marine Lab has been collecting CTD profiles at twelve sampling locations along a transect through the estuary since around 2008, which provide measurements of temperature, salinity and dissolved oxygen. From this data, I have developed estimates of habitat volume based on habitat suitability criteria developed by the Water Quality Parameter and Habitat Productivity Technical Group. There is a large amount of data available, and a number of different ways of visualizing and exploring the data. I can produce over two-hundred maps of the different habitat parameters alone, and I have also been tasked with visualizing habitat quality and availability for various depth and predation risk categories as well as how habitat changes over time as a closure develops. In addition, there is a lot of supplemental data—such as time series of river discharge, tide and wave data, and weather variables—that provide context for interpreting the habitat volume results. It’s not difficult to develop such graphics; rather, the challenge lies in making these graphics available to the group. After a bit of thought, I realized that the best way forward was to develop some kind of interactive tool that would allow the working group to explore the data on their own, rather than overwhelming them with pages and pages of plots and maps.
Shiny is a web application framework for R that
allows programmers to develop interactive apps. Making an app doesn’t require
any knowledge of HTML, CSS or Javascript; pages are constructed using R
functions and a wide variety of
templates and examples are available.
Furthermore, you don’t technically need to
configure a server or
pay for hosting; you can simply distribute your
code and launch apps from R.
Since I’m working with a small(ish) group, I opted to build a package that
launches the web app through a simple function call. I’ve included screenshots
of some of the app panes below, but you can also try it out yourself; the
package is available on Github
and can be accessed directly via devtools::install_github. After loading
the package, launch the web app in your default browser with a call to
HabitatBrowser(). Providing my results as an interactive app accomplishes
two things: first, it frees up time that would ordinarily be spent organizing
plots and developing a lengthly report (that probably would not ever be read)
for more productive tasks, such as new visualizations and analyses; and second,
it allows the technical group to access and explore the data both individually
and as a group, stimulating discussion.
The web app is still under active development, and things are likely to keep changing as the working group explores the data and tweaks their habitat criteria (as well as thinks up new visualizations for me to generate). But now I have a framework in place for incorporating new transects as they become available, and the working group has a simple-to-use interface for exploring my results.
Comments
Want to leave a comment? Visit this post's issue page on GitHub (you'll need a GitHub account).