I’ve been with DWR for almost a year and half now, and I continue to be involved with analyses for the Delta Smelt Resiliency Strategy. In particular, I’ve continued to do modeling and statistical analysis of water quality data to quantify the effects of operating the salinity control gates on delta smelt habitat in Suisun Marsh. One thing I’ve been playing with lately is looking at alternative metrics of quantifying the habitat benefit of operating the gates, with a particular focus on assessing changes in habitat extent, rather than simply area, and how this might play into questions regarding smelt population resiliency. My analysis is pretty half-baked right now, but I’m honing in on analyses that consider linear measures of habitat along stream networks.
I’m working with a geographic stream network (the National Hydrography Dataset) to map out Delta smelt habitat, which comes in the form of a collection of polylines. What I really want, though, is a network—a data structure I can use to ask questions about habitat contiguity. I also am working with water quality rasters generated by a computer model, and I need some way to associate this data with the stream network. ArcGIS has a framework for network layers, but it seems pretty specific to transportation applications and not general network analysis or representation.
In the end, I came up with my own process for converting a polyline layer into the components of a network—namely, the node and edge lists. It gets a bit fiddly, but hopefully I’ve broken the process down into something digestable.
Some optional prep work
Depending on the application, we may need to capture the polyline geometry and spatial variation more explicitly in the structure of the resulting network object. In my case, conditions changed significantly along the length of any given polyline, so I needed many points per line in order to adequately represent the spatial variation in conditions. I also wanted to keep the geometry of my polylines intact, so I needed multiple points along the line in order to capture the coordinates and curvature of the lines. I accomplished this by densifying my polylines using the ArcGIS Densify tool.
Capturing network nodes from the polylines
A network is defined as collection of “nodes” connected by “edges”. Logically,
the polylines will correspond to edges in the resulting network and the nodes
are the junctions between polylines, i.e. the polyline vertices.
We need to extract the polyline vertices as a point layer
in order to generate the node list needed to construct the network. We can
generate this “nodes” layer from the polyline layer with the ArcGIS
Feature Vertices To Points
tool. We want each vertex of every line to be captured only once in the output,
so specify the argument point_location = "ALL". In addition to generating an
OBJECTID for each vertex, the resulting layer will also have a “ORIG_FID” layer
that captures the ID of the original line segment.
Unfortunately, converting a polyline layer where individual polylines connect
will produce duplicate vertices at those junctions, because a point will be
created for each line at each junction. At the same time, some vertices
might not be created at all because some lines might terminate at a junction while
others actually pass through the junction (depending on how the polylines were
created in the first place). The easiest way to handle the second issue is to first
dissolve our polyline layer into a single feature using the ArcGIS
Dissolve
tool, and use Feature Vertices To Points on the dissolved layer to get a
list of vertices. This will also remove duplicate points where one segment ends and the
next begins, but it will still result in a duplicate points at junctions where more
than two lines connect. We can remove these duplicate points using the ArcGIS
DeleteIdentical
tool and specifying the argument field = "Shape" to delete duplicates based on their
location.
Note that removing duplicate in this way will leave gaps in the OBJECTID of the vertices layer. If you know that your graph creation software assumes that network nodes have sequential IDs, you can fix the issue simply by making a copy of the layer with the ArcGIS CopyFeatures tool.
Capturing network edges from the polylines
Most programs that construct networks can accept an “edge list” that defines connections between nodes. Typically, the edge list is a two-column table with the “from” nodes listed in the first column and the “to” nodes listed in the second column. We have the polylines themselves, but we need to do some legwork in order to generate the list of “from” and “to” nodes that define each polyline.
Things get a little fiddly if we needed to do the prep work of densifying and dissolving our polylines, because we likely want to capture the “from” and “to” nodes of each segment of the line, not just the start and end of the whole line. We therefore need to create a layer of polyline segments, where each segment corresponds to a node in the network. We can use the ArcGIS Split Line At Vertices tool to convert long polylines into many short segments. We need to use the dissolved polyline layer here, for the same reason we did for the vertices: we need to ensure that segments end at junctions, rather than passing through them.
Now that we have the segments defined, we can capture the “from” and “to”
node lists through some repetitive use of the ArcGIS
Feature Vertices To Points tool. We have to run the tool twice on the segments
layer: the
first time we specify the argument point_location = "START" to capture
the “from” nodes of each line, and the second time we specify
point_location = "END" to capture the “to” nodes of each line.
In both cases, the resulting layer will have the field “ORIG_FID”
that identifies the ID of the original line segment.
Although we are able to identify the start and end vertices using the
Feature Vertices To Points tool, the object IDs are not consistent between the
two layers. Since the “to” vertex of one segment is also the “from” vertex of the
next segment, we need to use consistent IDs for the vertices in the “from” and
“to” point layers. There are a few ways to accomplish this, but one easy way is
to use the ArcGIS
Identity
tool. Run this tool for each of the “from” and “to” point layers, specifying the
“nodes” layer from step one as the identity_feature argument. We really only
need to the OBJECTID of the points in the “node” layer, so we can specify the
argument join_attributes = "ONLY_FID".
The next step is to join the “from” and “to” node identifiers back to the polyline segment layer. Since the Feature Vertices To Points tool keeps information on the identity of the original polyline using the “ORIG_FID” field, we can use this field with the ArcGIS Join Field tool to join the “from” and “to” node IDs back to the segments. If you don’t have any additional information from the polyline segments layer that you want to capture your network (e.g. segment length, name, etc.) you can join the “from” and “to” layers directly on the “ORIG_FID” field. Otherwise, you’ll need to run the Join Field tool twice to join both the “from” and “to” layers to the polyline segments layer. You’ll only need to join the field containing the IDs of the node layer, but this field has the same name in the “from” and “to” layers; you may want to modify the field names of the “from” and “to” layers before joining in order to keep things straight. The end result is the “edge list” that defines our network object.
Capturing node and edge weights
We now have a node list and edge list that together define the structure of the network. If the geometric structure is all we need, we can jump straight to our program of choice (e.g. R, Python, etc.) to construct the network from the edge list. However, it’s likely that we want to capture other information to define properties of the network nodes and edges.
For example, perhaps we have a raster that underlies our polyline network, and we want to capture the raster value underlying each node in our network. We can use the ArcGIS Extract Vaues to Points tool to add the underlying raster values as an attribute to each point in the “node” layer we generated earlier. If we want to extract values from multiple rasters, we can use the Extract Multi Values to Points tool instead. One issue to keep in mind is that using Extract Vaues to Points may reorder your OBJECTIDs, so do this step before you start constructing the edge list or create a copy of the OBJECTID field first, so that you don’t lose the original feature ordering (alternatively, just use Extract Multi Values to Points even when you’re only using one raster, because it will add the raster attributes without reordering your OBJECTIDs). If we want our network to have a spatial reference, we can also attach the coordinates of the vertices with the ArcGIS Add XY Coordinates tool.
Edge weights are only slightly trickier, and it really depends on what we want
to capture. The “edge list” layer we created earlier likely already has some
attributes, e.g. the length of each segment. We can attach other line information
too, such as the line bearing. However, if we want to get information that isn’t
directly calculable from the line—for example, the average raster value under
the line—we need to do some more legwork. One option is to assign
the average of the edge’s start and end node attributes to the edge after
constructing the network. If we need to some GIS analysis to determine the
edge attributes, one option is to
generate the midpoints of each line segment via the Feature Vertices To Points
tool with the argument point_location = "MID", do whatever analysis we need on
those midpoints (e.g. extract the values from a raster via the
Extract Vaues to Points tool), and then join those fields back to the
“edge” layer using the Join Field tool. If we need to re-associate attributes
that were originally associated with the polylines but were lost when the polyline
layer was dissolved, we can add those back in using the Identity tool.
Constructing the network
Once we have the “node” and “edge” layers, it’s (probably) straightforward
to construct the network in the program of our choice. The exact way
to do this obviously depends on what program you’re using; in R, we
can construct a network using the igraph package function
graph_from_data_frame(), which takes an edge list and node list (as
dataframes, with additional columns interpreted as edge/node attributes)
as inputs. The advantage of using R
is that we can also use the sf package to read the attribute tables of the
spatial layers directly using the sf_read() function, i.e. we don’t
need to export the attribute tables of the “node” and “edge” layers to a
text file first.
A demonstration
I converted these steps into an R script that uses my arcpy package for R:
library(arcpy)
use_ArcGIS(pro = TRUE)

arcpy$env$workspace = "example.gdb"
stream.network = "suisun_marsh_streamlines"

## Prep work

# densify the network
stream.network.dense = arcpy$edit$Densify(stream.network, "DISTANCE",
  10.0)

#dissolve the network
stream.network.dissolve = arcpy$management$Dissolve(stream.network.dense,
  "streamlines_dissolve")

## Nodes

# generate the node list from the dissolved streamlines
stream.network.vertices.raw = arcpy$management$FeatureVerticesToPoints(stream.network.dissolve,
  "streamlines_vertices_raw", "ALL")
# delete duplicates
arcpy$management$DeleteIdentical(stream.network.vertices.raw, "Shape")
stream.network.vertices = arcpy$management$CopyFeatures(stream.network.vertices.raw,
  "streamlines_vertices")

## Edges

# split the dissolved streamlines into segments
stream.network.segments = arcpy$management$SplitLine(stream.network.dissolve,
  "streamlines_segments")

# get the "from" and "to" node lists from the segmented streamlines
stream.network.from = arcpy$management$FeatureVerticesToPoints(stream.network.segments,
  "streamlines_from", "START")
stream.network.to = arcpy$management$FeatureVerticesToPoints(stream.network.segments,
  "streamlines_to", "END")
# identify the original node IDs in the "from" and "to" node lists
stream.network.from.id = arcpy$analysis$Identity(stream.network.from,
  stream.network.vertices, "streamlines_from_id", "ONLY_FID")
stream.network.to.id = arcpy$analysis$Identity(stream.network.to,
  stream.network.vertices, "streamlines_to_id", "ONLY_FID")
# field renaming for future clarity
arcpy$management$AlterField(stream.network.from.id,
   "FID_streamlines_vertices", "fromFID")
arcpy$management$AlterField(stream.network.to.id,
   "FID_streamlines_vertices", "toFID")
# join the from/to IDs to the streamline segments
arcpy$management$JoinField(stream.network.segments, "OBJECTID",
  stream.network.from.id, "ORIG_FID", list("fromFID"))
arcpy$management$JoinField(stream.network.segments, "OBJECTID",
  stream.network.to.id, "ORIG_FID", list("toFID"))

## Node attributes

# add XY coordinates to node list
arcpy$management$AddXY(stream.network.vertices)

## Edge attributes

# generate segment midpoints
stream.segment.midpoints = arcpy$management$FeatureVerticesToPoints(stream.network.segments,
  "streamlines_midpoints", "MID")
# add raster values to edge list base on midpoint
salinity.raster = "Percent_time_lt6psu_100mG"
arcpy$CheckOutExtension("Spatial")
stream.segment.midpoints.rasterval = arcpy$sa$ExtractValuesToPoints(stream.segment.midpoints,
  salinity.raster, "streamlines_midpoints_salinity")
arcpy$CheckInExtension("Spatial")
# join midpoint attributes back to segments
arcpy$management$JoinField(stream.network.segments, "OBJECTID",
  stream.segment.midpoints.rasterval, "ORIG_FID", list("RASTERVALU"))
Now that the node and edge lists have been constructed, it’s trivial to build a network object:
# read in the node list and edge list
nodes = da_read(stream.network.vertices,
  c("OBJECTID", "POINT_X", "POINT_Y"))

edges = da_read(stream.network.segments,
  c("fromFID", "toFID", "GNIS_Name", "Shape_Length", "RASTERVALU"))

#construct the network
library(igraph)
g = graph_from_data_frame(edges, FALSE, nodes)

# plot with ggraph
library(ggraph)

ggraph(g, layout = "manual", x = POINT_X, y = POINT_Y) +
  geom_edge_link(aes(color = RASTERVALU)) +
  scale_edge_color_distiller("% time below 6 PSU", palette = "BuPu", direction = 1) +
  coord_fixed() +
  theme_graph()
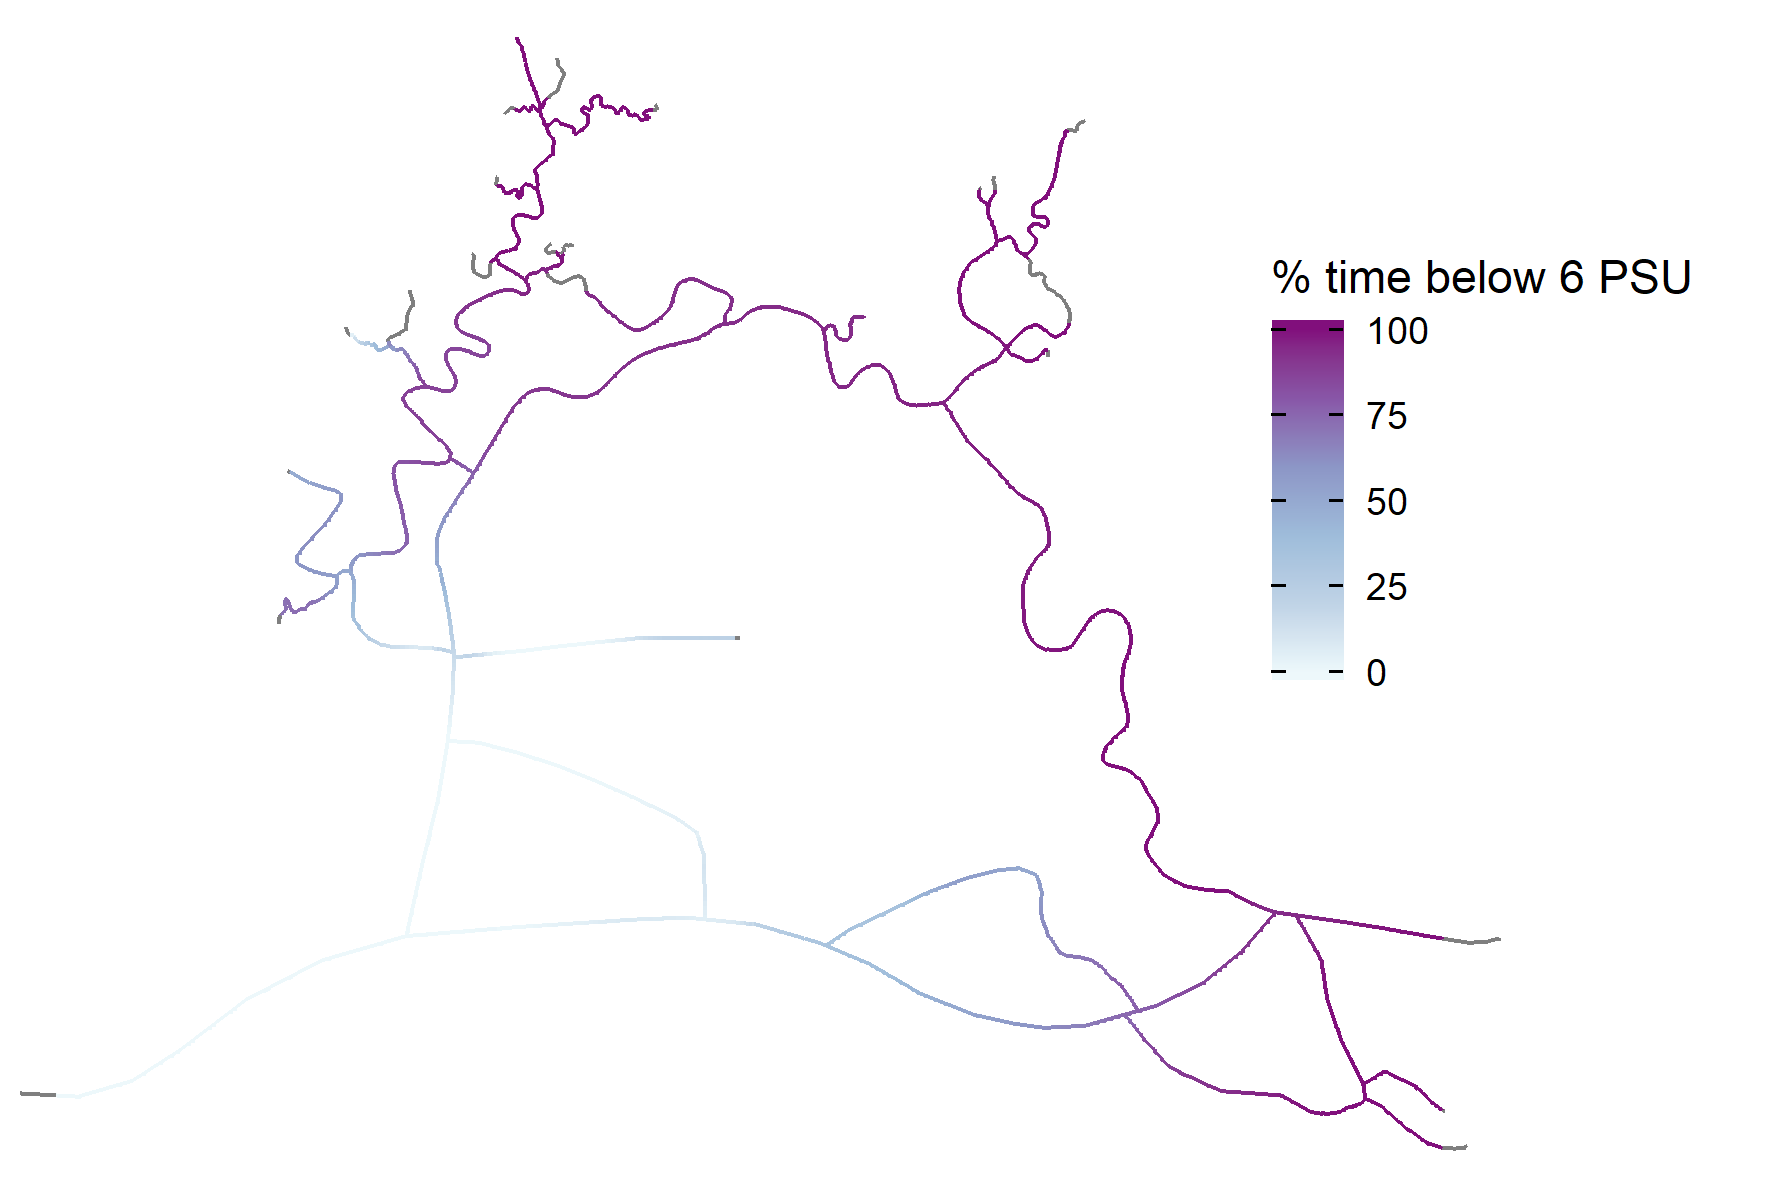
That’s a surprising amount of code for something that conceptually is quite simple. However, it wouldn’t be hard to generalize the above process into a function. For me, the payoff is worth it—now that I have a network object, I can use graph theory to do some interesting analyses.
Comments
Want to leave a comment? Visit this post's issue page on GitHub (you'll need a GitHub account).